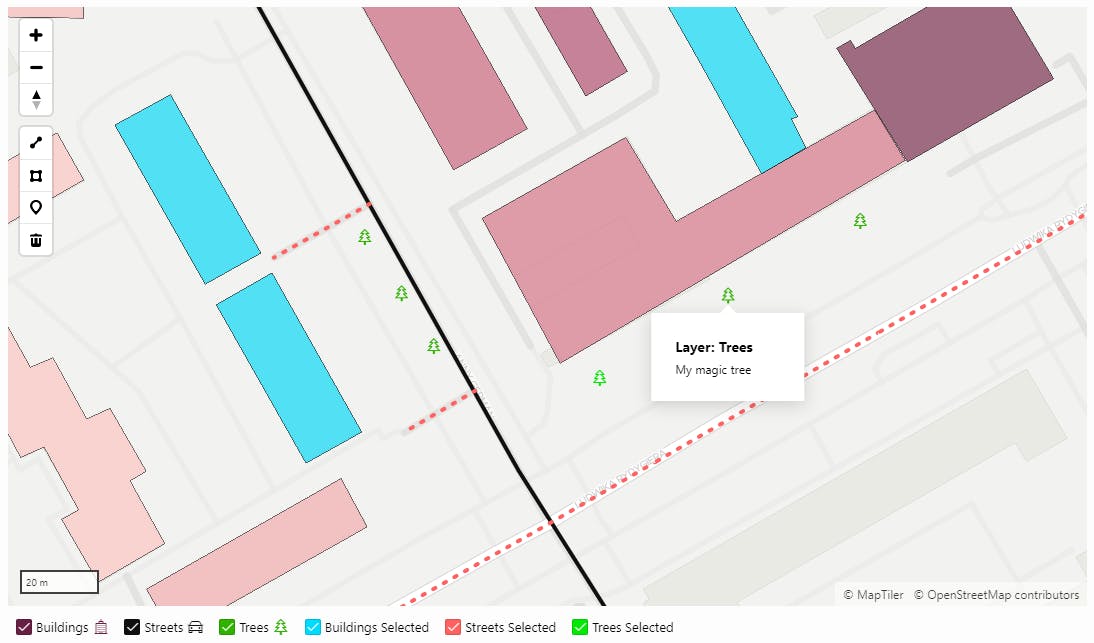
Layers are logical collections of geographic data that are used to create maps. Oracle APEX allows us to create layers based on data from a database or REST service. Additionally, we can easily change the way our layers are displayed and define attributes such as Clustering, Tooltips, or Zoom Levels.
Oracle APEX allows us to create five different types of layers:
Points
Lines
Polygons
Heat Maps
Extruded Polygons

In addition to the basic attributes, each layer has attributes specific to the selected data type. For a Points layer, this may include the Points Clustering option, or for an Extruded Polygons layer, the Extrusion Value Column.
In this article, we will use a table that contains data about objects such as:
Buildings
Streets
Trees
An example record from my MAP_OBJECTS table looks like this:

Layers - Common Attributes
Tooltip -The tooltip is displayed when the user hovers the cursor over the selected object.
Link - The action to be performed after clicking on the object. Three possible options are:
Redirect to Page in this Application
Redirect to Page in a Different Application
Redirect to URL
Info Window - A pop-up that appears after clicking on a selected object, extending the functionality of the tooltip.
Zoom Levels - Minimum (1) and maximum (18) zoom values at which the layer becomes visible.
Legend - Basic settings for legend visibility, including layer and icons.
Points
Section: Point Objects
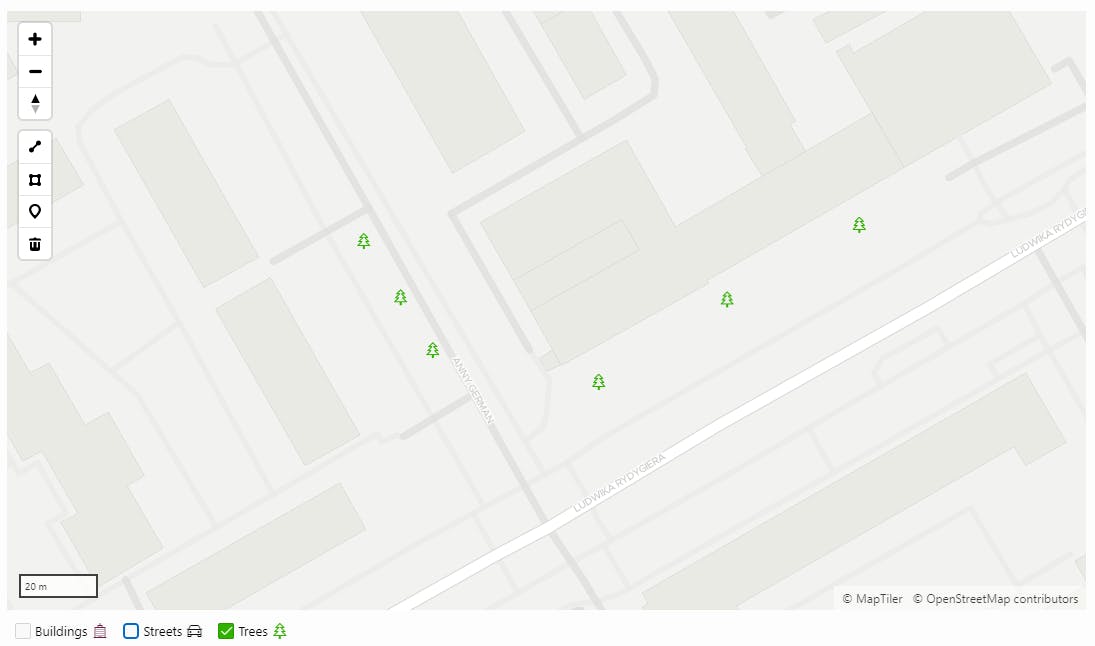
The "Style" attribute identifies how to display the point object. We have two options here: display as an "SVG" shape and select an "SVG Shape" from the list of available shapes, then specify the "Shape Scale" (scaling factor). The second option is "Icon." We can define the "Icon Source" by selecting one of three options: "Icon Class," "Icon Class Column," or "Image URL."
Section: Appearance
In this section, we can define the appearance of markers or icons. If we decide to display the "SVG" shape in the "Appearance" section, we can define the following parameters: "Fill Color," "Fill Opacity," "Stroke Color," and "Stroke Width." If our point is displayed using an icon, we have two parameters: "Fill Color" and "Fill Opacity."
Section: Point Clustering
This is a very interesting option available out of the box. In this section, we can define parameters such as "Clustering Radius" (in pixels) and modify the appearance of clusters by selecting the "Fill Color" or "Tooltip."
Lines
Section: Appearance
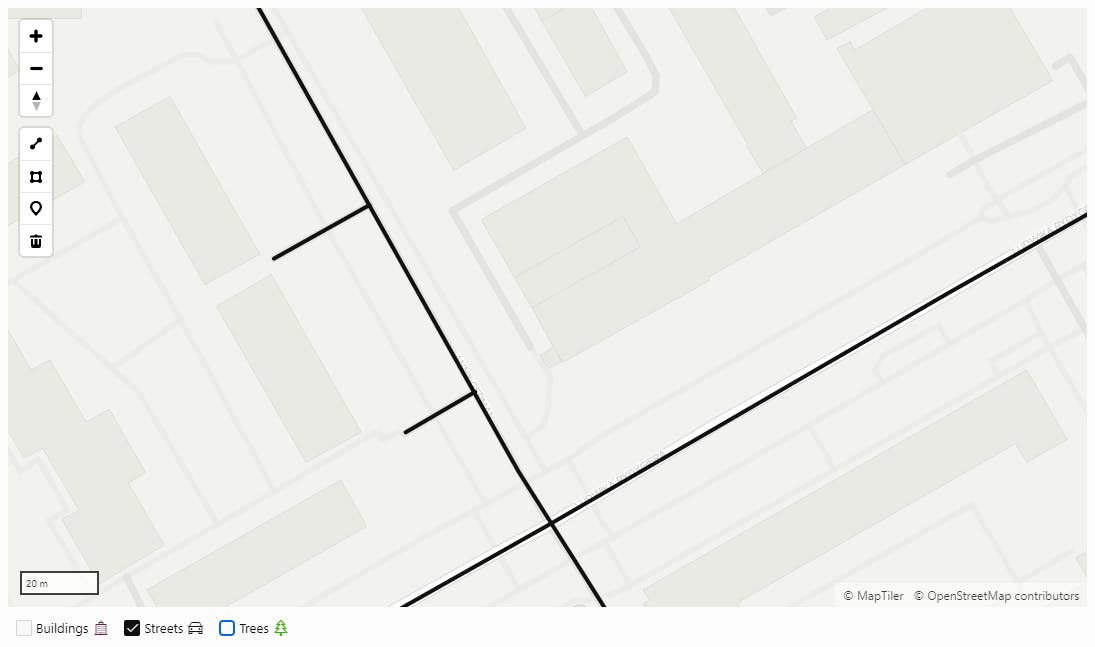
In this section, as with the previous layer, we define the appearance of our objects. There are three attributes available: "Stroke Style" with values: "Solid", "Dotted", "Dashed" and "Dot-Dashed". "Stroke Color" and "Stroke Width" (minimum 0.05 and maximum 10).
Polygons
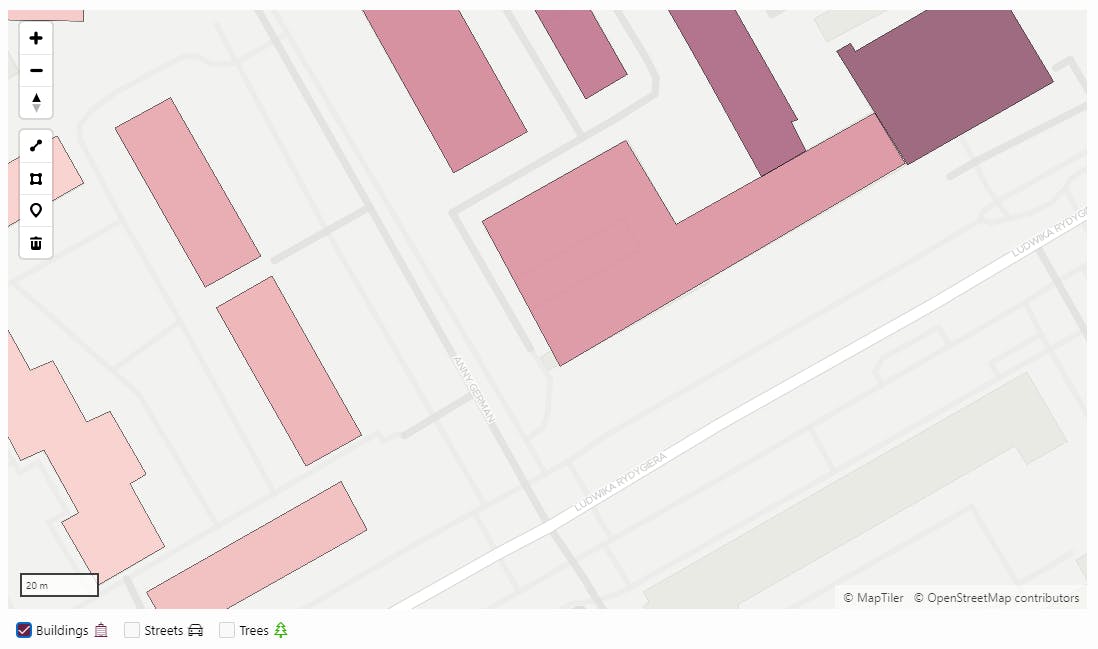
Section: Appearance
No surprises here! In this section, we define the appearance of our objects. The first attribute is "Use Color Schema". If we turn off this attribute, the appearance of our objects will be defined by the following parameters: "Fill Color", "Fill Opacity" and "Stroke Color". If we enable the "Use Color Schema" attribute, we will be able to use a ready-made or custom color list. The "Color Scheme" attribute has four values: "Custom", "Sequential", "Diverging" and "Qualitative". The "Custom" option allows you to define your own list of colors, for example: "#ff0000, #ff2020, #ff4040, #ff6060, #ff8080, #ffa0a0, #ffc0c0, #ffffff". In other cases, we can choose from a ready-made list.
Heat Map
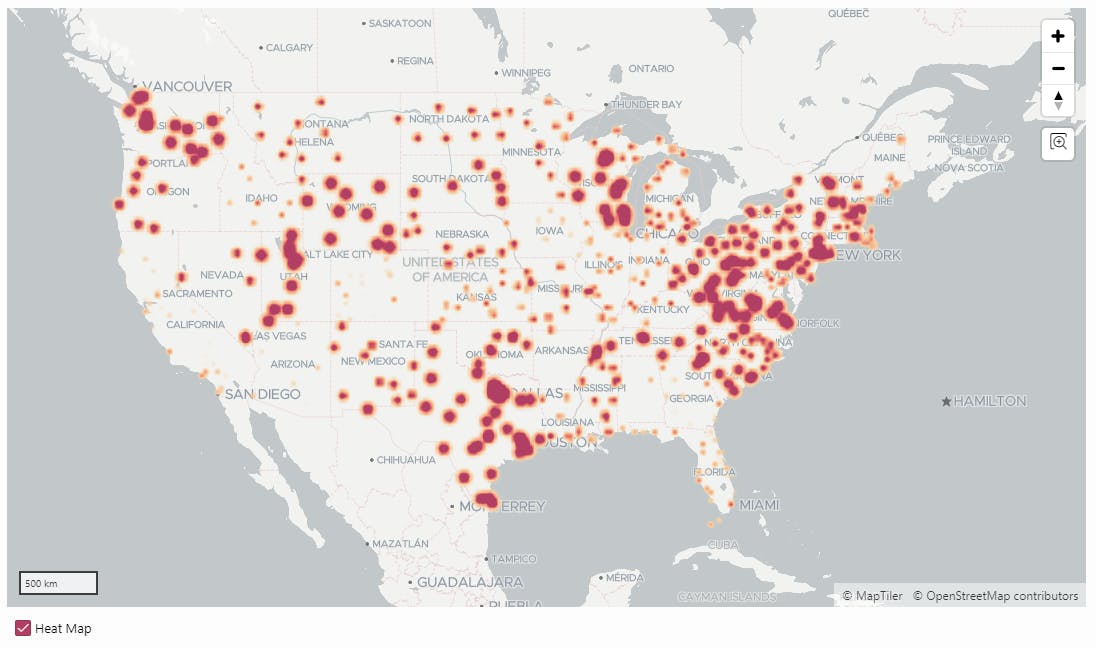
A heat map is a type of layer that allows you to display points. Heat maps are useful for visualizing the density of point objects. For example, we will use the EBA_SAMPLE_MAP_AIRPORTS table from the Sample Maps application. Below is a heat map showing the distribution of all US airports. In areas with a greater number of airports, the color is darker. Similar to Polygons, in the "Appearance" section, we can define a list of colors by selecting one of four possible options: "Custom", "Sequential", "Diverging" and "Qualitative".
Extruded Polygons
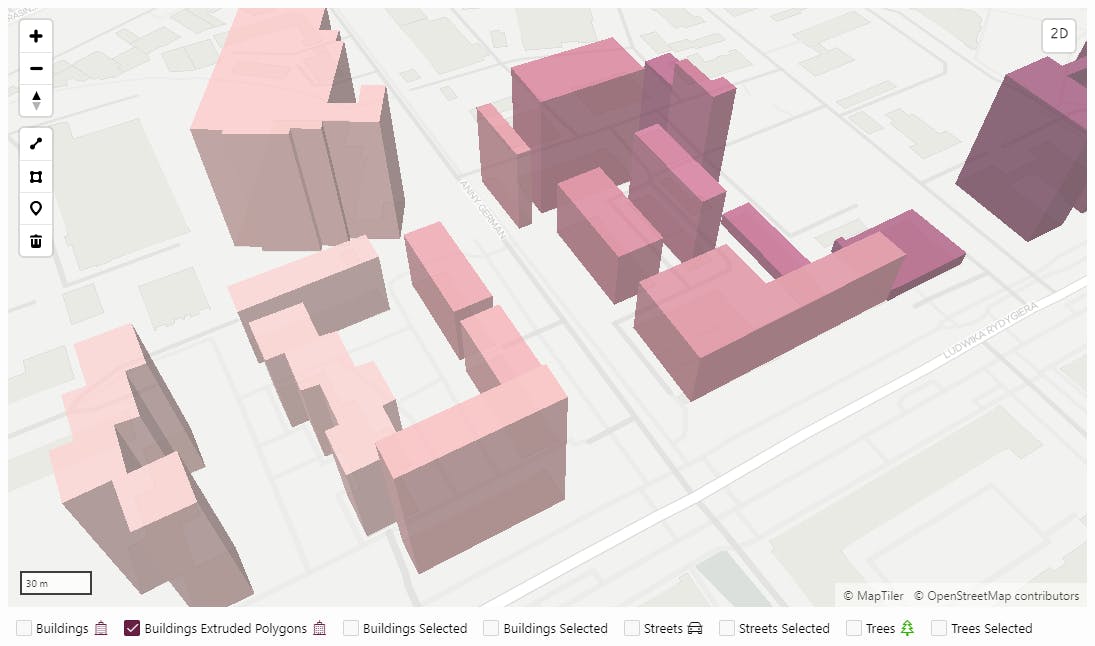
"Extruded Polygons" are three-dimensional (3D) objects. They are based on polygons, but we can also define the height of our objects. They resemble charts displayed on our map. In the "Appearance" section, similar to polygons, we can use the "Use Color Schema" attribute. We can choose a ready-made color list, define our own, or disable the "Use Color Schema" option and set the "Fill Color"parameter to specify a single color. Additionally, we have two new attributes here: "Extrusion Value Column" (the value that determines the height of the extruded polygon) and "Unit" (which specifies the height unit of the extruded polygon) with the following values: "Meter", "Kilometer", "Foot", "Mile".
Conclusions
The map region supports five different layer types: Points, Lines, Polygons, Heat Maps, and Extruded Polygons. All layers share the same sections and attributes, such as "Zoom Levels" or "Tooltip". The "Appearance" section, which varies depending on the layer type, allows us to define how our objects appear. This provides us with numerous possibilities, making our maps even more user-friendly.
All layers represent trees, streets, and buildings:
